A Structure for Summer – Methylammonium Lead Halides

Summer is upon us down in the Southern Hemisphere and as the days heat up we will most likely be seeing a whole lot of sun. Wouldn’t it be great if we could harness all that solar energy? Well, fortunately for us there is literally no single technological issue that can’t be solved with a perovskite.

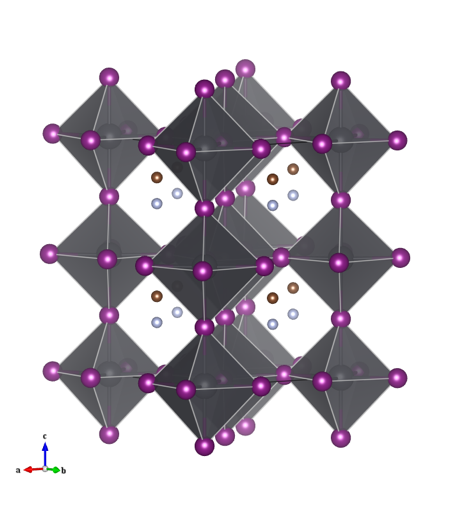
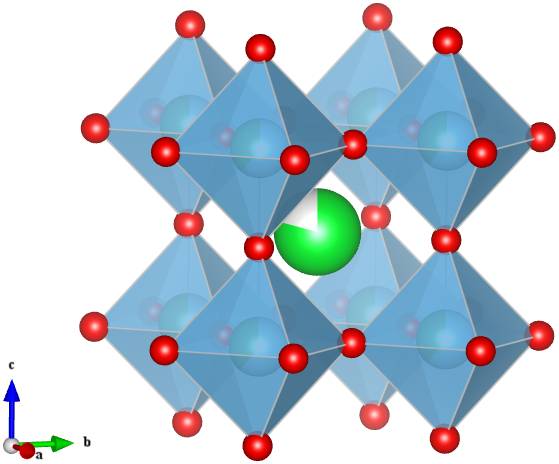
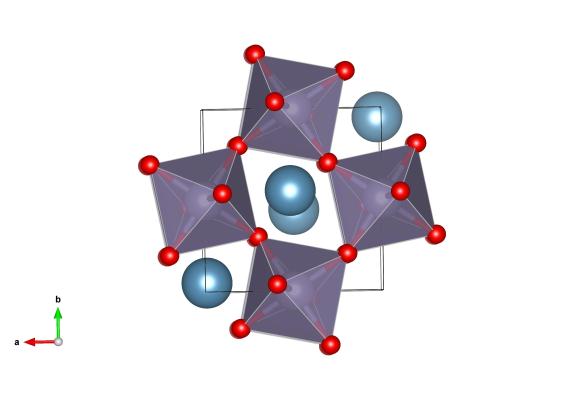
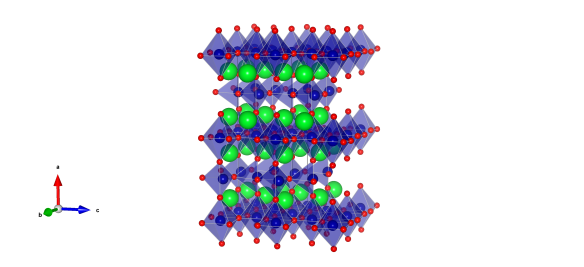
This is no ordinary perovskite however. In earlier articles I described perovskites with the formula ABX3, where A is a large cation, B is a smaller cation and X is an anion. The large A-site cation does not necessarily have to be an atom, it could be for example, a large positively charge organic compound. The light harvesting perovskites that have been causing quite a stir in the solar cell industry contain a methyammonium cation on the A-site with lead halide octahedra forming the corner linked network (Figure 1) [1].

Figure 1: Crystal structure of methylammonium lead iodide.

Figure 1: Crystal structure of methylammonium lead iodide.

These perovskites have attracted quite a bit of attention due to the unprecedented improvements in energy conversion efficiency (that is how efficiently they convert solar energy to electricity) over the past five years. While they started off at 3.8 % in 2009 [2], the perovskite solar cell efficiency is now 19.3 % [3]. For reference, current commercial crystalline silicon is between 17-23 % efficient [4]. Of course the main concern to the average consumer is cost, and this is where perovskites really begin to shine. Perovskite solar cells are made from cheap starting material and are easier to manufacture compared to the currently employed crystalline silicon solar cells.

Figure 2: Perovskites can be used in two solar cell architectures, (a) a sensitized perovskite solar cell and (b) thin film solar cells ("Perovskite solar cell architectures 1" by Sevhab - Own work. Licensed under CC BY-SA 4.0 via Wikimedia Commons [5])

Figure 2: Perovskites can be used in two solar cell architectures, (a) a sensitized perovskite solar cell and (b) thin film solar cells (“Perovskite solar cell architectures 1” by Sevhab – Own work. Licensed under CC BY-SA 4.0 via Wikimedia Commons [5])

The other more recently discovered benefit of the methylammonium perovskites is the role they play in the actual solar cell. In the simplest form of a solar cell, there is a material which acts as the light harvester, absorbing visible light and generating a negative charge (electron) and positive charge (“hole”). These charges are transferred into a material which allows the negative charges to be extracted to an external circuit as electricity (Figure 2). Originally titanium dioxide, which acted as the charge transfer material, was coated with the perovskite as a sensitiser to absorb visible light. It was recently discovered that the methylammonium lead halide perovskite can act as both the light harvester and charge transfer material. This discovery paved the way for perovskites to be used in alternate solar cell architectures, such as thin film solar cells.

It isn’t all sunshine and rainbows for perovskites however. The perovskite itself isn’t actually stable under humid conditions as it readily dissolves in water. Further, there have been concerns surrounding the use of toxic lead, although some progress has been made in this area by replacing lead with tin. Also, like any perovskite, the structure is tuneable with different A-site and halide variants possible leading to further improved properties for the tin varieties.

The future is bright, the future is perovskite.

The structure is #4335638 in the Crystallography Open Database

[1] Stoumpos, C. C.; Malliakas, C. D.; Kanatzidis, M. G. Inorg. Chem. 2013, 52, 9019.

[2] Kojima, A.; Teshima, K.; Shirai, Y.; Miyasaka, T. J. Am. Chem. Soc. 2009, 131, 6050.

[3] Service, R. F. Science 2014, 344, 458.

[4] McGehee, M. D. Nature 2013, 501, 323.

[5] Perovskite solar cell architectures 1 <http://commons.wikimedia.org/wiki/File:Perovskite_solar_cell_architectures_1.png#mediaviewer/File:Perovskite_solar_cell_architectures_1.png&gt; (Accessed 12/2014)

Local Order Hidden Inside the Average Order in PZN

Short Range Order, what is it and why is it tricky?

Modelling short-range order (SRO) is tricky. Since in a system with SRO you cannot assume that all unit cells are the same, conventional crystallographic ideas — like Rietveld refinement or conventional single crystal refinement of diffraction data — just don’t work. These tools are useful for giving you the global average structure, but they don’t tell you about the local configurations that make up that average.

It is a bit like looking at the average of a room full of people. The average person might be 45% male and 55% female, 1.7m tall, 68kg in weight… but there is a lot more information to be had. What is the average weight of the males? Average height of the females? And, of course, the average person does not really exist, so knowing this average might not be very useful.

Similarly with materials, if we want to know how the useful properties arise from the structure and we only have the average structure, then if the system shows disorder, then this average might not ever actually occur, so doing crystal chemical calculations based on it will lead us astray.
A good example of this is the family of relaxor ferroelectrics, one of the best known being PZN, PbZn1/3Nb2/3O3. It is a perovskite, which we’ve seen plenty of this year. In this case, the PZN unit cell can be modelled by considering the Pb sites to really consist of 12 Pb sites, one along each of the [110] directions.

What does it look like?

A unit cell of PZN, with Pb (green), Zn.Nb (blue) and O (red).  The Pb are modelled as 12 split sites, on each of the [110] directions.

A unit cell of PZN, with Pb (green), Zn.Nb (blue) and O (red). The Pb are modelled as 12 split sites, on each of the [110] directions.

But what does the diffuse scattering look like?

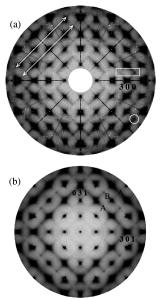
Evidence for SRO shows up in the diffuse scattering, the scattering between the Bragg reflections. Some diffuse scattering for PZN looks like this:

Diffuse scattering from PZN, (a) in the hk0 layer and (b) in the hk1. Streaks, diamonds and other shapes are all clearly visible, all containing information about the SRO in PZN.

Diffuse scattering from PZN, (a) in the hk0 layer and (b) in the hk1. Streaks, diamonds and other shapes are all clearly visible, all containing information about the SRO in PZN.

Now, the diffuse scattering in PZN can be modelled quite well by assuming that the Pb displace along [110] and these displacements are correlated in certain ways, and that the other atoms then relax around this Pb configuration. The problem is that these models are largely descriptive and artificial. They are based on human interpretation of the data, and do not necessarily relate directly to the underlying chemistry.

Modelling the Diffuse Scattering

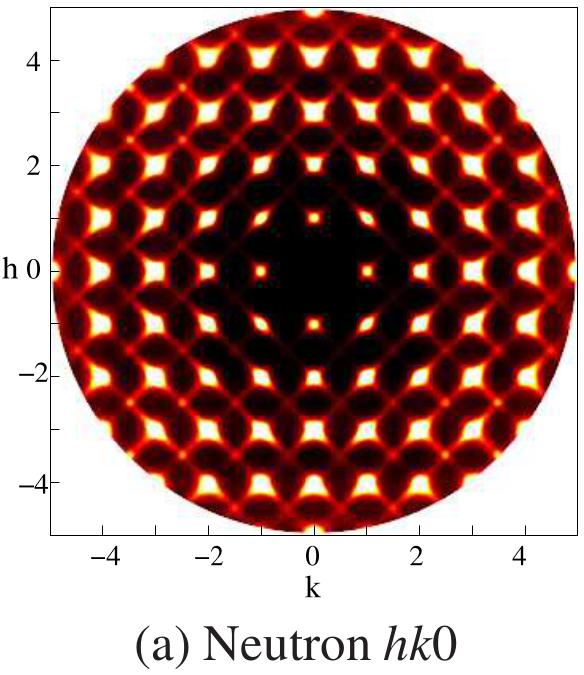
In the simulation, atomic positions were swapped around and configurations kept or rejected based on whether they reduced the global instability index or not. This was after initial random distributions had been established based on the average structure. This means that the histograms of atomic separations always give the correct average and overall atomic displacement parameters, so all this SRO can be ‘hidden’ inside a conventional average structure.

Calculated hk0 diffuse from PZN.

Calculated hk0 diffuse from PZN.

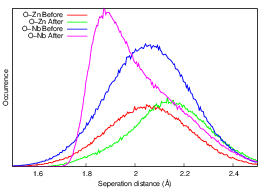
And this approach really can give diffuse scattering which looks a lot like the observed and which reveals what is ‘inside’ the average and see how the Nb behaves compared to the Zn, and so on…so below we can see that the O-Nb distances change compared to the O-Zn, even though there is no long-range order in the distribution of Nb and Zn.

plot_dist_size_bvs_o_b

By modelling the SRO, it is possible to see how the environment around Nb is different to that around Zn, while retaining the overall average shown by conventional studies.

The highly structured diffuse scattering, and the local ordering that gives rise to it, can exist in the system without influencing the outcomes of conventional structural studies. This indicates that short-range order may be present, and crucial, and unsuspected, in many systems whose structures are thought to be thoroughly determined.

Where did this all come from?

This is all from work described in a paper by Whitfield et al.

Growing crystals for your PhD, – The trials and tribulations Part 1

Will Brant tells us about growing Sr1-xTi1-2xNb2xO3 crystals for his PhD

For this post (and the next) I decided to do something a little different and talk about stories from my PhD which are in line with a crystal growing theme. Growing nice large crystals is not easy; there are so many factors which can influence the outcome of the growth of one specific type of crystal that some may consider it an art form. I found this out the hard way through my forays into trying to grow two seemingly similar, but ultimately very different, oxide materials. That is, Sr0.8Ti0.6Nb0.4O3 and Sr3TiNb4O15 (or Sr0.6Ti0.2Nb0.8O3).

The first of the two crystals I attempted to grow, Sr0.8Ti0.6Nb0.4O3, is a defect perovskite structure derived from the cubic perovskite SrTiO3. To get to Sr0.8Ti0.6Nb0.4O3 from SrTiO3 the TiO+4 cations are incrementally substituted with Nb+5 cations. In order to balance the difference in charge between titanium and niobium, vacancies are produced on the strontium position. (see structure below)

Figure 1

Sr0.8Ti0.6Nb0.4O3 was originally created in an attempt to produce new kinds of A-site deficient perovskites for lithium ion conduction applications. While Sr0.8Ti0.6Nb0.4O3 itself is not a very good lithium ion conductor it did exhibit some interesting short range structural distortions.[1] By growing a large single crystal, these distortions could be studied in greater detail.

My crystal growing method of choice was the floating zone furnace. To grow a crystal using this method, the ends of two sintered powder rods of a near-pure target material are melted using the focused heat from high power lamps. These molten regions are brought into contact with one another to produce a molten zone suspended between the two powdered rods. As the rods are moved vertically the molten zone travels through the polycrystalline powder. As the melt leaves the hot region crystals begin to form as the material cools. Over time, if all goes well, the growth of one of these crystals will predominate and a large, high quality single crystal will result.

The floating zone furnace.

The floating zone furnace.

The process began by preparing a pure Sr0.8Ti0.6Nb0.4O3 powder. This took around two to three weeks of repeated grinding and sintering. Once a rod of the polycrystalline material was prepared the growth could begin. By begin in this sense I mean about four trial growths were attempted to establish the best conditions. The hard work and long hours finally paid off however, as by the fifth attempt a stable growth had begun! However, this came to a grinding halt as a bubble began to form inside the melt. The bubble become larger and larger as the growth continued before finally bursting sending molten material flying out from the melt zone.

So what went wrong? Ironically, the presence of a few vacancies, while not in sufficient quantity to allow for lithium diffusion, encouraged entirely different, unintentional ion diffusion. That is, of oxygen ions! At high temperatures and slightly reducing conditions, oxygen is removed from the material. This gas became trapped in the melt gradually accumulating to the point where eventually a bubble of O2 burst and ruined everything.

It was time for round 6: remove as much oxygen as possible before attempting crystal growth. Given that oxygen rapidly left the material at high temperatures, this involved heating both the powder and then the sintered rod up to 1350 °C for extended periods of time. This time around, no bubbles formed and it appeared as though the melt and crystal growth were actually stable.

Lump!

Lump!

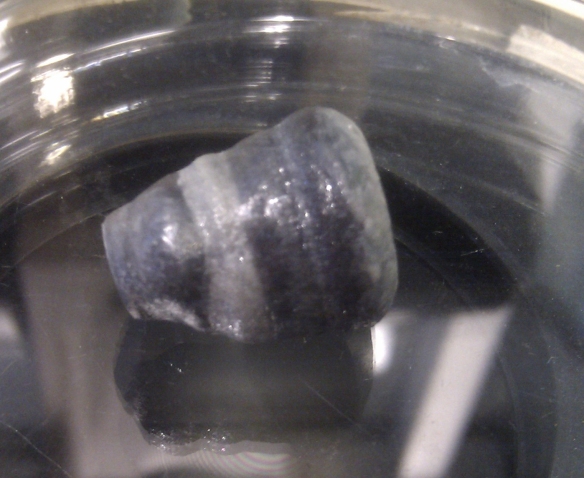
What did I get for my effort? A large lump of super dense highly fused polycrystalline ceramic. So, not a crystal. The lump was so large and dense that I couldn’t actually break it into smaller pieces despite my enthusiastic efforts to do so (RIP mortar and pestle). This lump of perovskite now sits in my desk. By this point I had decided to abandon trying to grow Sr0.8Ti0.6Nb0.4O3 crystals because another material was proving to be much more successful, Sr3TiNb4O15

To be continued…..

Let’s Get Popping! – Ruddlesden-Popper Structures

What does it look like?

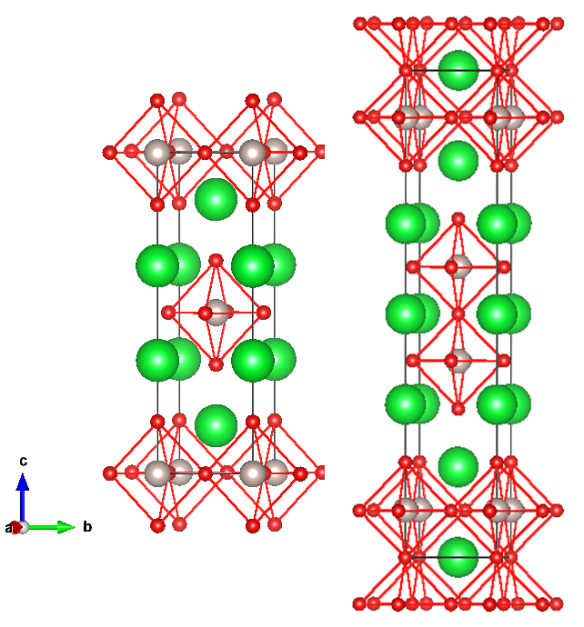
Left: Sr2RuO4 Right: Sr3Ru2O7, both images made with VESTA.

Left: Sr2RuO4 Right: Sr3Ru2O7, both images made with VESTA.

What is it?

If you’re familiar with the perovskite (which regular readers should be by now), then you are familiar with one of the building blocks of Ruddlesden-Popper structures. The slightly complicated looking formula for this type of material is An-1A’2BnX3n+1. What this means is that this material has two types of cations, A and B atoms, with X being the anions in the system. Shown above are the cases for n = 1 (left) and n = 2 (right).

All types of Ruddlesden-Popper structures share same basic layout: in the middle of the unit cell is a perovskite layer, where an ABX3 structure forms. Above and below that is a layer comprised of B cations surrounded by X octahedral. The A’ cations appear between at the boundary of the two types of layers.

But this series of structures extends beyond n = 2, although making those materials can be quite the challenge! However, research groups that specialize in thin film growth, such as those from Cornell University  or Argonne National Lab have recently been able to fabricate a variety of Ruddlesden-Popper samples.

Where did this structure come from?

As you may have guessed from the name of these structures, they were first synthesized and described by S.N. Ruddlesden and P. Popper, with the n = 1 structure (left) published in 1957 and the n = 2 (right) following a year later in 1958.

Ordering matters: Not all brownmillerites are created equal

What is it?

Early in the blog we were introduced to perovskite, one of the simplest and most common mineral structures. A vast number of crystals are derived from the perovskite structure, which typically contains two different metals (A and B) and a counteranion, such as oxygen (O), in the ratio ABO­3.

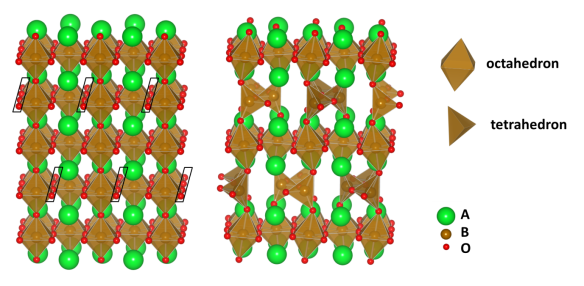
The brownmillerite structure (blogged on March 5) is one such derivative of perovskite, created by removing one-sixth of its oxygen atoms in rows. The B-metal atoms nearest the “missing” oxygens now have only four oxygen neighbours, which form a tetrahedral shape around them; the other B-metals have a full set of six oxygen neighbours, which form an octahedral shape. (Why octahedral? Six corners = eight faces!) Each tetrahedral shape is linked at the corners to two others, making long parallel chains of tetrahedra which extend throughout the crystal in one direction.

Removal of the black-boxed O atoms from perovskite (left) produces the brownmillerite structure (right).

Removal of the black-boxed O atoms from perovskite (left) produces the brownmillerite structure (right).

Now it gets complicated…

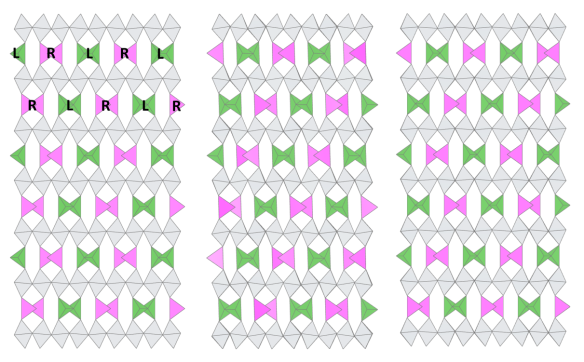
The tetrahedra, with their two missing oxygen corners, turn out to be a bit too big for the space they’re in, so they twist slightly to make a better fit. Because each tetrahedron is linked in a chain, the whole chain has to twist the same way, either left (L) or right (R). The question is: if the first chain twists to the left, which way will the next chain try to go? The same way (L)? The opposite (R)? Or will it choose an orientation at random, without any reference to its neighbour?

In fact, there are many different ways that the chain-twists can be ordered in brownmillerite materials. Researchers in the 20th Century grouped brownmillerites into three categories based on their interchain relationships:

1) all chains the same type

2) layers of L alternating with layers of R

3) all chains completely random

In the early 2000s, however, A. Abakumov and coworkers began to notice features in their electron diffraction images that were inconsistent with these three simple models. Subsequent re-investigations using modern high-quality diffraction data revealed a range of more complicated patterns in many known brownmillerites, most of which had previously been contentious or identified as “random”-type structures.

Just three of the possible L-R chain ordering arrangements in brownmillerites

Just three of the possible L-R chain ordering arrangements in brownmillerites

Besides creating some interesting problems for crystallographers to solve, the brownmillerite superstructure can actually provide us with information about the physical properties of these useful materials. For example, it was recently shown that oxide-ion conductivity in Sr2Fe2O5 is triggered by the “loosening” of some of its oxygen atoms at temperatures above 600 °C, where thermal energy allows the chains to move and randomise. At lower temperatures, however, a complex ordering pattern is observed among the chains, demonstrating that there isn’t enough energy to allow the oxygen atoms to move around. (Auckett et al. Chemistry of Materials 25 (2013) p.3080-3087) In this way, crystallography might be used to predict which brownmillerites could potentially conduct oxide ions at lower (industrially useful) temperatures.

Where does it come from?

The common brownmillerite superstructures are described by Abakumov et al. in the Journal of Solid State Chemistry 174 (2003) p.319-328, and in other publications.

A specially named perovskite, Megawite

What does it look like?

Image generated by the VESTA (Visualisation for Electronic and STructual analysis) software http://jp-minerals.org/vesta/en/

Image generated by the VESTA (Visualisation for Electronic and STructual analysis) software http://jp-minerals.org/vesta/en/

What is it?

Helen Megaw who’s birthday it would be today was, alongside Kathleen Lonsdale and Dorothy Hodgkin, a pioneer of crystallography. Where Lonsdale made great leaps in molecular crystallography and Hodgkin paved the way for understanding larger molecules, Helen Megaw made a great contribution to our understanding of minerals and in particular perovskites. Perovskites do keep popping up on the crystallography 365 blog, and that really does emphasis how important the understanding of this crystal structure is to a range of sciences, from the depths of our Earth to materials science.  Helen Megaw was the first to work out the structure of a perovskite, from her work on barium titanates. This pioneering work led to this perovskite material, calcium tin oxide, being name Megawite after her.

She also made a great contribution to the promotion of crystallography to a wider audience, instigating the ‘Atoms to Patterns’ exhibition which featured in the 1951 Festival of Britain. Bringing together the big name science of the day, the exhibition brought atomic drawings to patterns on everyday objects – curtains, plates, ties and ashtrays.

Where did the structure come from?

Megawite was identified by Galuskin et al in 2011, it is #9015771 in the crystallography open database.

It’ a bird…it’s a plane…it’s a Superlattice!

What does it look like?

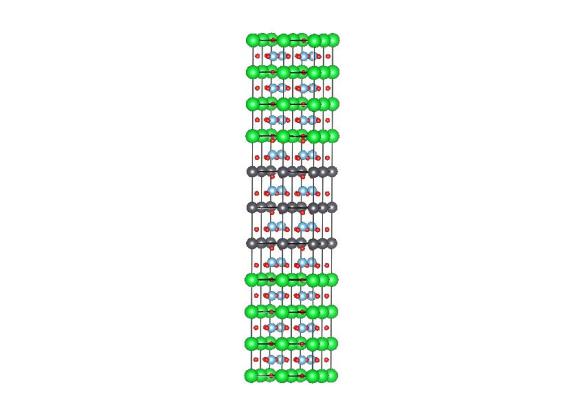
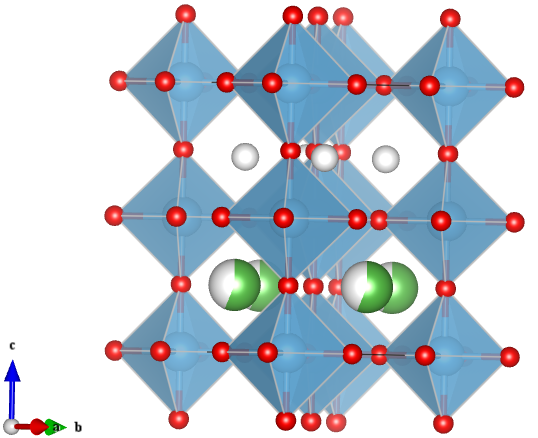
This superlattice structure consists of 4 unit cells of SrTiO3 alternated with 3 unit cells of PbTiO3. The Sr atoms are green, Pb atoms are grey, Ti atoms are blue, and O atoms are red.  Image generated by the VESTA (Visualisation for Electronic and STructual analysis) software http://jp-minerals.org/vesta/en/

This superlattice structure consists of 4 unit cells of SrTiO3 alternated with 3 unit cells of PbTiO3. The Sr atoms are green, Pb atoms are grey, Ti atoms are blue, and O atoms are red. Image generated by the VESTA (Visualisation for Electronic and STructual analysis) software http://jp-minerals.org/vesta/en/

What is it?

Regular Crystallography 365 readers may remember the perovskite. Since this is a relatively simple crystal structure and can be found with a wide variety of atoms on the cube corners and centers, it’s relatively easy to build “stacks” of alternating layers of different perovskites. When these stacks are layered in a repeated manner, this is called a superlattice.

Superlattices are exciting because of the many effects that occur due to the individual properties of the constituent layers and also because of how those layers interact. One of the most well-studies systems has been LaAlO3/SrTiO3. Even though both materials are insulators by themselves, when you alternate them in thin layers superconductivity appears at the interfaces!

The example above shows a PbTiO3/SrTiO3 superlattice. PbTiO3 is a ferroelectric, meaning it has a native electric polarization (this comes from the O and Ti atoms being displaced from the unit cell center – which you can see if you look closely). When you reduce the number of PbTiO3 layers you may expect the superlattice to become less ferroelectric, but competing structural distortions of the individual PbTiO3 and SrTiO3 layers at the interface actually allow the whole system to sustain ferroelectricity even when the sample is made up of mostly non-ferroelectric SrTiO3.

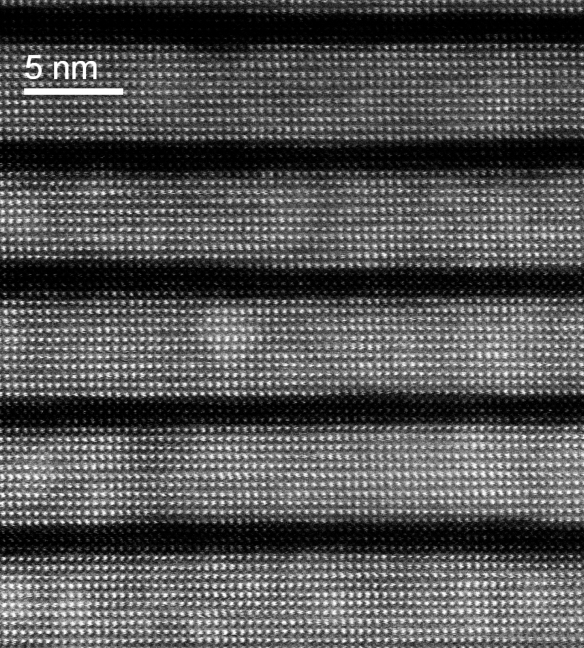
A TEM image of a perovskite superlattice

A TEM image of a perovskite superlattice

Of course, superlattices don’t have to just be made of perovskites. However, because all perovskites share a general form it is easy to alternate thin layers of different materials while ensuring that they maintain good crystal quality.

Where did this structure come from?

Both the crystal structure and TEM image are PbTiO3/SrTiO3 superlattices. It was made by starting with the SrTiO3 structure (#9006864 in the Crystallography Open Database) and then adding a PbTiO3 layer (#9011192 in the Crystallography Open Database). The in-plane lattice parameters of the PbTiO3 layer were confined to those of the SrTiO3 layer to simulate epitaxial strain. As a result the out-of-plane lattice parameter of the PbTiO3 layer was made larger, which is observed experimentally.


Organize your oxygen with brownmillerite, SrCoO2.5

What does it look like?

Image generated by the VESTA (Visualisation for Electronic and STructual analysis) software http://jp-minerals.org/vesta/en/

Image generated by the VESTA (Visualisation for Electronic and STructual analysis) software http://jp-minerals.org/vesta/en/

In the SrCoO2.5 structure shown above the green are strontium atoms, the blue atoms are cobalt atoms, and the red are oxygen atoms.

What is it?

Not too long ago, you were introduced to the extremely versatile perovskite structure. In addition to being a widely observed crystal structure itself, the perovskite form can be found as a “building block” in many other types of structures. Today’s crystal structure, brownmillerite, has perovskite layers that alternate with layers of oxygen tetrahedra that center on the B atom (here Co), forming a superstructure.

Brownmillerite SrCoO2.5 is particularly interesting because of how it forms. SrCoO3 has a classic perovskite material. But cool things happen when you start creating oxygen vacancies within the system. Rather than have the vacancies spread randomly throughout the crystal, which occurs in most materials, they create a new order! (For your fancy vocabulary word of the day – this is called a topotactic phase transformation.) This is the origin of the oxygen tetrahedra, which are made of two fewer oxygen then the octahedral in the perovskite layers. The difference in structure between perovskite SrCoO3 and brownmillerite SrCoO3 has been known for a while, but recent work has shown that the phase transition between the two can be engineered through temperature and environment (see Jeen et al. in Advanced Materials or Nature Materials).

Where did this structure come from?

While the electrical and magnetic properties of oxygen deficient SrCoOx materials were first thoroughly studied by Hiroshi Wantanabe in 1957 the first structural study on the brownmillerite SrCoO2.5 was reported by Wantanabe, Takayoshi Takeda, and Yasuo Yamaguchi in 1972.

Super Fast Ions – Solid Ion Conductor Lithium Lanthanum Titanate

What does it look like?

—Image generated by the VESTA (Visualisation for Electronic and STructual analysis) software http://jp-minerals.org/vesta/en/

—Image generated by the VESTA (Visualisation for Electronic and STructual analysis) software http://jp-minerals.org/vesta/en/

Here the oxygen anions are red, titanium is blue, the partial lanthanum occupancy is indicated with the mixed grey/green and lithium is grey. While the structure is shown with two distinct layers of A-sites, in reality there is some disorder and mixing of Li and La between each layer.

What is it?

The Lithium lanthanum titanates, Li3xLa2/3-xTiO3 (LLT), are a series of compounds which are themselves part of a subset of perovskites known as A-site deficient perovskites. Originally discovered by Brous et al. in 1953, members of this perovskite series were originally studied for their potential dielectric properties arising from displacements of the Ti4+ cation.[1,2] However, there was not a lot of success in this area due to another physical property which lead to the discovery of LLT’s most impressive and significant application as a solid state electrolyte.

It was mentioned in an earlier post that the perovskite structure consists of a large A-site cation inside a cage created by BX6 octahdra where the B-cation is smaller than the A-site and X is an anion. In LLT, lithium and lanthanum both occupy the A-site, the B cation is Ti and X is oxygen. However, unlike standard perovskites, not every A-site is occupied for most compositions in the Li3xLa2/3-xTiO3 series, resulting in vacancies. In addition, the lithium does not actually sit in the centre of the A-site, but rather slightly off-set towards the oxygen window between A-sites. These unique structural aspects are what give rise to the extremely fast lithium ion conductivity exhibited by these materials. In fact, the specific composition Li0.34La0.51TiO3 has the highest lithium ion conductivity compared to all other solid ion conductors at room temperature. [3] Impressively, the lithium ion conductivity comes close to even that of liquid electrolytes currently used in lithium ion batteries (1.53 x 10⁻³ S cm-1 for LLT compared to 1 x 10⁻² S cm-1 for LiPF6 dissolved in dimethylcarbonate and ethylene carbonate). Incidentally, the high ion conductivity is what makes LLT a poor dielectric material.

Where did the structure come from?

While the basic LLT structure is well known, there are many contradicting reports to the exact structure. It has been determined through a combination of variable temperature neutron, synchrotron and electron diffraction that the structure, and resulting physical properties, are dependent on the exact composition and thermal history of the compound. The most commonly reported structure – the layered tetragonal defect perovskite structure is provided below for Li0.3La0.567TiO3.

[1] Brous, J.; Fankuchen, I. & Banks, E., Acta Crystallogr., 1953, 6, 67-70

[2]  Inaguma, Y.; Chen, L.; Itoh, M.; Nakamura, T.; Uchida, T.; Ikuta, H. & Wakihara, M. Solid State Commun., 1993, 86, 689-93

[3] Stramare, S.; Thangadurai, V. & Weppner, W. Chem. Mater., 2003, 15, 3974-3990

The first perovskite – Calcium Titanate

What does it look like?

Image generated by the VESTA (Visualisation for Electronic and STructual analysis) software http://jp-minerals.org/vesta/en/

Image generated by the VESTA (Visualisation for Electronic and STructual analysis) software http://jp-minerals.org/vesta/en/

What is it?

One of the most common and versatile structure types, perovskites, cannot be considered without first paying homage to the original perovskite, calcium titanate.  First discovered in the Ural Mountains of Russia by Gustav Rose in 1839, the mineral was named after the mineralogist Count Lev Aleksevich von Perovski.

Starting from a face centered array of anions, the perovskite structure can be derived by replacing one pair of adjacent anions (labelled as X) in the unit cell by a similarly sized cation, referred to as the A-site cation. Smaller B-site cations can then be placed in interstitial sites such that they are surrounded by six anions. This results in the formula ABX3, which is the generic formula for a perovskite. A visual representation of this transition is shown below where the A-site cation is indicated in orange, the B-site in blue and the anions are red.

How to build a perovskite

How to build a perovskite

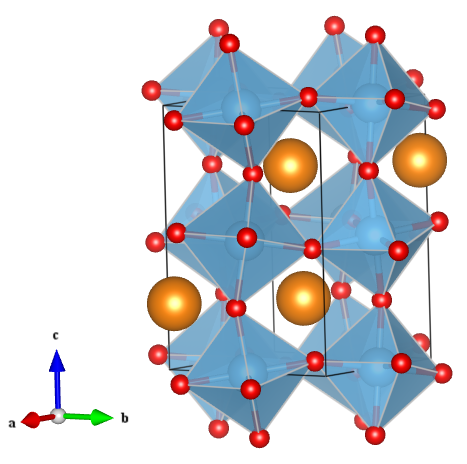
Due to the high versatility of the perovskite structure, virtually every element in the periodic table can be incorporated into a perovskite structure, resulting in a vast array of properties and applications. For calcium titanate specifically, calcium is the large A-site cation, titanium the smaller B-site cation and oxygen the anion, giving the formula CaTiO3 (also shown in the figure).

CaTiO3 is arguably one of the less interesting perovskite structures, compared to its more exotic cousins. Nonetheless, one of CaTiO3’s main uses is as one of the major components in Synroc, a synthetic rock form designed for the immobilization of radioactive waste, due to the ability to host for the nuclear fission product strontium.

Where did the structure come from?

While on-going advances in both crystal growth and diffraction techniques have enabled more accurate measurements of the CaTiO3crystal structure, it largely has not changed from the distorted orthorhombic perovskite structure determined by Kay & Bailey in 1957.