A note

And here we are at the end, a year since our first post – on the structure that started it all, salt. Three hundred and sixty five structures later (and with only one repeat, did you notice?) we are at the end of the Crystallography 365 project and the end of the International Year of Crystallography. Thank-you for reading all our posts, and we hope that they have expanded your crystallography horizons somewhat.

We’re thinking about the legacy for the project, if nothing else we’ll make sure all the structure pictures we’ve drawn make it to Wikipedia, upping the amount of crystal structures there. We’ll make sure all the structures we found that weren’t in the Crystallography Open Database (or any other) head that way soon. We hope that it will be a good teaching resource and a museum to the diversity of crystallography.

Thanks for reading!

From Crystallography to Light!

As the International Year of Crystallography gives way to the International Year of Light, we end the #Crystallography365 series with a retrospective of how research in optics has advanced crystallography, and a prospective on how it will do so in the future.

There was crystallography before x-rays, but since 1912 the field has been intimately connected to x-ray optics [1]. In 1895, just after Maxwell had shown that light was a transverse electromagnetic wave, Rontgen discovered x-rays while conducting experiments of the optical properties of cathode rays. Rontgen’s mysterious x-rays captured worldwide attention; but particularly that of Arnold Sommerfeld’s. Although a theoretician himself, he had assembled an impressive group of experimentalists in his research group. Sommerfeld had surmised that that x-rays were transverse EM waves with a wavelength on the order of 1 angstrom, and furthermore that diffraction through a suitably sized slit would prove this fact.

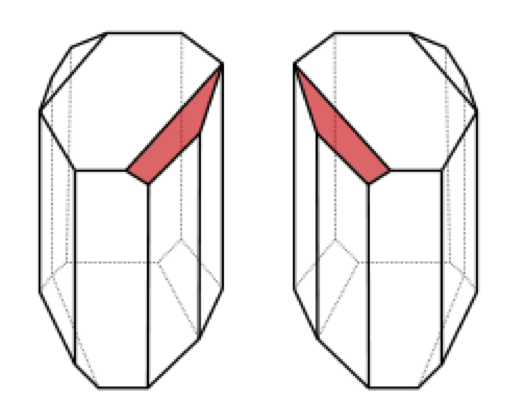
In 1912 Max Von Laue, then an experimentalist in Sommerfeld’s group, showed that crystalline materials diffract x-rays, thus in just one single experiment demonstrating the wave nature of x-rays and the lattice structure of crystals [2]. Then using mathematical arguments from wave optics W.L Bragg (the son) developed his groundbreaking formulas relating the intensity of spots and structure. Later, using optics and engineering, W.H. Bragg (the father) constructed the first x-ray spectrometer, and Weissenberg invented the x-ray camera named after him [3].

The invention of synchrotron light sources and advances in x-ray optics have boosted crystallography to new heights. Synchrotrons were first built for particle physics applications. X-ray radiation production in synchrotrons is an energy-sapping nuisance, and literally holes needed to be drilled in the particle pipe to let the x-rays out. Of course scientists soon realized that this ‘waste radiation’ might be useful after all [4]. Today with many exotic x-ray optical designs, large synchrotron machines give crystallographers more and more brilliant monochromatic x-rays, and with the ability to get higher and higher resolutions in both space and time. This has been particularly useful in powder and macromolecular applications.

In the coming years research in optics holds many exciting opportunities for crystallographers. Advances in plasma photonics are reducing the size of x-ray sources such that light with characteristics previously only available at large synchrotron user facilities becomes available from machines small enough for individual labs [5-7].

Free electron lasers (FELs) provide peak brilliance 8 orders of magnitudes larger than synchrotron light sources, and pulses on the order of 10s of femtoseconds [8]. FELs are enabling ultra-short, but still ultra-bright light pulses that allow reliable structure determination from much smaller crystals. This is extremely important for protein crystallographers, shaving possibly years off the current process and opening the door to bigger and more membrane bound complexes [9]. The ultra-short pulse length and high repetition rates mean that chemical dynamics will routinely be studied crystallographically [10].

At the end of this celebration of 100 years of x-ray crystallography, crystallographers are in a sense where they’ve been all along, at the forefront of optics research. So the International Year of Light is a perfect successor to the International Year of Crystallography.

[1] Nave, C. (1999), Matching X-ray source, optics and detectors to protein crystallography requirements, Acta Cryst. D55, 1663-1668, doi:10.1107/S0907444999008380

[2] Von Laue, M. (1915), Nobel Lecture: Concerning the Detection of X-ray Interferences”. Nobelprize.org. Nobel Media AB 2014. Web. 31 Dec 2014. http://www.nobelprize.org/nobel_prizes/physics/laureates/1914/laue-lecture.html

[3] Weissenberg K., Ein neues Röntgengoniometer. Z. Physik, 23 (1924),229-238, doi: 10.1007/BF01327586

[4] Phillips, J. C., Wlodawer, A., Yevitz, M. M., & Hodgson, K. O. (1976). Applications of synchrotron radiation to protein crystallography: preliminary results. Proceedings of the National Academy of Sciences of the United States of America, 73(1), 128–132, PMCID: PMC335853

[5] Corde, S., Phuoc, K. T., Lambert, G., Fitour, R., Malka, V., Rousse, A., … & Lefebvre, E. (2013). Femtosecond x rays from laser-plasma accelerators. Reviews of Modern Physics, 85(1), 1, doi: 10.1103/RevModPhys.85.1

[6] Schlenvoigt, H-P., K. Haupt, A. Debus, F. Budde, O. Jäckel, S. Pfotenhauer, H. Schwoerer et al. (2007). A compact synchrotron radiation source driven by a laser-plasma wakefield accelerator. Nature Physics, 4(2), 130-133, doi:10.1038/nphys811

[7] Lyncean Technologies, http://www.lynceantech.com/

[8] Margaritondo, G., & Rebernik Ribic, P. (2011). A simplified description of X-ray free-electron lasers. Journal of synchrotron radiation, 18(2), 101-108, doi: 10.1107/S090904951004896X

[9] Spence, J. C., & Chapman, H. N. (2014). The birth of a new field. Philosophical Transactions of the Royal Society B: Biological Sciences, 369(1647), 20130309, doi: 10.1098/rstb.2013.0309

[10] Minitti, Michael P., James M. Budarz, Adam Kirrander, Joseph Robinson, Thomas J. Lane, Daniel Ratner, Kenichiro Saita et al. Toward structural femtosecond chemical dynamics: imaging chemistry in space and time. Faraday discussions 171 (2014): 81-91, doi: 10.1039/C4FD00030G


Shrinking in the heat – lanthanoid hexacyanidocobaltates, a.k.a. LnCo(CN)6

While most materials expand when heated, a few show the opposite behaviour, known as negative thermal expansion (NTE). The record holder, which has the greatest rate of volume contraction upon warming over a wide temperature range, is single-network cadmium cyanide (we previously blogged about the double-network version). This unusual phenomenon is useful – if you combine an NTE material with a normal material in just the right ratio, you can make a mixture with zero thermal expansion. Such a composite is immune to the undesirable effects of thermal expansion, from the buckling of railway tracks in the heat, to quartz-crystal clocks gaining or losing time when it’s too hot or cold.

A related group of frameworks which also show NTE are the lanthanoid hexacyanidocobaltates, with chemical formula LnCo(CN)6, where Ln can be any element from the lanthanoid row of the periodic table from lanthanum (La) to lutetium (Lu), Co is cobalt, and CN is cyanide. The cyanide is tightly bound to the cobalt, so these materials aren’t particularly toxic, unlike potassium cyanide.  They can be easily crystallised from a solution as shown in this time-lapse video, recorded over the course of a few hours.

LaCo(CN)6·5H2O is easy to grow, and forms nice hexagonal crystals. By the end of the video, they are about 2 mm in size and have started to merge together. Once the water is removed from the crystal structure by heating, the NTE properties are activated.

The key to the NTE is the networked structure of the materials. The lanthanoid and cobalt atoms are ‘bridged’ together by the cyanide (CN) ions. As the temperature rises, these linkers start to vibrate more and more in skipping-rope-like transverse (sideways) vibrations. Just like the ends of a skipping rope get closer together when you vibrate it, these transverse motions cause the average metal-metal distances to decrease, thereby causing contraction of the crystal.

The LnCo(CN)6 frameworks’ lanthanoid and cobalt metal atoms are linked together by cyanide bridges. ‘Skipping rope’ transverse thermal vibrations of these bridges bring the metal atoms closer together and cause the contraction of the whole material as it heats up.

The LnCo(CN)6 frameworks’ lanthanoid and cobalt metal atoms are linked together by cyanide bridges. ‘Skipping rope’ transverse thermal vibrations of these bridges bring the metal atoms closer together and cause the contraction of the whole material as it heats up.

Crystallography (powder diffraction in this case) allows the dimensions of the unit cell to be precisely measured, which lets us monitor the thermal expansion of materials by taking diffraction measurements at a number of different temperatures. The results for a series of LnCo(CN)6 compounds are shown in the plot below, and demonstrate that we can tune the NTE properties just by making the material with different lanthanoid metals. Swapping Lu for La doubles the steepness of the plot. This is because La bonds more loosely to the cyanide linkers than Lu does, making a more flexible framework with bigger transverse vibrations, and therefore bigger NTE.

NTE_2

The crystal structure of LaCo(CN)6 is made up of trigonal prismatic lanthanum (green) and octahedral cobalt (blue) metal atoms linked together by cyanide bridges (grey/blue). The plot shows the negative thermal expansion (NTE) behaviour of several different LnCo(CN)6 frameworks (with Ln = La, Sm, Y, Ho and Lu) measured using X-ray powder diffraction at the Advanced Photon Source. Larger lanthanoid metals, such as La, give a more flexible framework and a stronger NTE effect. The neutron diffraction measurements (black) allow us to go to lower temperatures, revealing how the NTE behaviour dies out, deviating from the nice straight line as the transverse vibrational modes “freeze out”. These results were published in S.G. Duyker et al. (2013), Angew. Chem. Int. Ed., 52: 5266–5270.

54 nets and nothing fishy

Prof Batten tells a tale of why it’s always healthy to be skeptical!

What is it?

One of the most important qualities of a scientist is scepticism. The predisposition to doubt conclusions without solid supporting evidence is vital. Nowhere does this apply more than to your own work.

So when one of my colleagues requested my help with a structure that they thought contained 54 interpenetrating three-dimensional networks my initial reaction was that, in polite terms, they’d made a mistake somewhere and I’d need to find it. Yes, interpenetration of networks is quite common in framework structures – see, for example, the two interpenetrating diamond nets in the structures of zinc cyanide and cadmium cyanide, discussed previously on this blog. But the previous ‘record’ was only 18 nets, an exceptional number in itself. This was three times that – there was no way that so many independent 3D networks could pass through each other without bumping into themselves, nevermind the incredible self-assembly process that must happen for such a structure to form. It simply defied belief.

I was wrong.

The structure did, of course, contain 54 interpenetrating, independent networks. Each network was composed of silver atoms bridged by tri(4-imidazolylphenyl)amine ligands. The ligands bridged in two different ways – one was bound to three metals, while the other coordinated to only two. Furthermore, all the silver atoms connected to only two ligands, meaning that the branching points of the networks, the centres of the 3-connecting ligands, were interconnected by parts of two 3-connecting ligands, pairs of silver atoms, and a 2-connecting ligand. As the ligands themselves were quite large, the nodes were therefore an enormous 36.85 Å apart. This very large distance between the nodes meant that an individual net was extremely spacious, and gave the necessary room for 53 other networks to form and entangle with the first. So a few hours and one headache later I found myself confirming that yes, the structure did indeed have that many unconnected networks all tangled up together.

Another interesting feature of this structure was that the networks formed had the “(10,3)-a” topology. This network is of particular interest because it is chiral – i.e. there are two different versions of the net that are mirror images of each other (in the same way that your left and right hands are mirror images and different). Remarkably, nets of both “handedness” were present in this structure – 27 of each – to give an arrangement that was overall nonchiral (or racemic – see the tartaric acid blog post for an explanation of this applied to discrete molecules rather than infinite networks).

What does it look like?

54_nets

Two of the 54 interpenetrating networks are shown schematically in the figure. Although distorted from the most symmetrical version of the (10,3)-a topology, the chirality of the nets can be seen in the rectangular spirals. Those of the blue net spiral into the page in an anti-clockwise fashion, while those of the red net spiral into the page in a clockwise fashion. The real structure, of course, squeezes another 52 nets into the space you see here.

Where did the structure come from?

“An Exceptional 54-Fold Interpenetrated Coordination Polymer with 103-srs Network Topology”, H. Wu, J. Yang, Z.-M. Su, S.R. Batten and J.-F. Ma, J. Am. Chem. Soc., 2011, 133, 11406-11409. DOI: dx.doi.org/10.1021/ja202303b

CCDC Refcode: OYEYOH


Decorative, but a little deadly – Torbernite

 What does it look like?

The crystal structure of Torbernite. Here the atom colours are; blue – uranium, orange – copper, purple - phosphorus, red – oxygen. Image generated by Mercury.

The crystal structure of Torbernite. Here the atom colours are; blue – uranium, orange – copper, purple – phosphorus, red – oxygen. Image generated by Mercury.

What is it?

Torbernite crystals exhibit exceptionally beautiful shades of green, from emerald to grass-green to apple-green, and thus may entice you to collect these crystals as ornaments for your tables – but beware; these crystals are capable of slowly leaking lethal radon gas which can cause lung cancer.

Image of a collection of torbernite crystals. Taken from: http://www.gemstonesadvisor.com/torbernite/

Image of a collection of torbernite crystals. Taken from: http://www.gemstonesadvisor.com/torbernite/

Torbernite crystals, Cu(UO2)2(PO4)2)·12H2O, are formed through a complex reaction of phosphorus, copper, water and uranium and form as secondary uranium deposits in granitic rocks. These materials belong to the autunite group and are found in the alteration zone of hydrothermal veins and pegamites that contain uraninite. Torbernite materials possess a significant environmental interest in that they exert an impact on the mobility of uranium in phosphate bearing systems such as uranium deposits and so can act as a reactive barrier that uses phosphate to limit the transport of uranium in groundwater. As such, the presence of torbernite has been used by prospectors as an indicator of uranium deposits.

Where did the structure come from?

Torbernite occurs in tabular blocks that may be very thin to moderately thick. The crystals have a perfect cleavage parallel to the basal plane and thus can resemble mica. This particular structure of torbernite that we have featured was presented in Locock, A.J. and Burns, B.C. The Canadian Mineralogist, 2003, vol. 41, pp. 489 – 502.

Pasteurized Crystals – Tartaric acid.

What is it?

December 27 marks the 192nd birthday of Louis Pasteur, which means that (a) he’d be really old if he hadn’t died in 1895, and (b) today is the perfect day to talk about tartaric acid.

Tartaric acid occurs naturally in many plants, particularly grapes. You’ve already read about ‘wine diamonds’ (potassium bitartrate), but you may not be aware of the contribution tartaric acid has made to scientific language.

Naturally occurring tartaric acid, first isolated in 1769, was found to rotate plane polarized light to the right. When it was prepared synthetically, tartaric acid had identical properties, except that it didn’t rotate plane polarized light. The synthetic material was thought to be a different compound, and was named racemic acid (from racemus, Latin for ‘a bunch of grapes’). It was subsequently determined that tartaric acid can exist in two different forms; and that naturally occurring tartaric acid was L-tartaric acid, while ‘racemic acid’ was actually an equal mixture of D and L-tartaric acid, mirror image isomers (enantiomers). These enantiomers were optically active in opposing directions, appearing optically inactive; this explained the otherwise identical properties of tartaric acid and racemic acid.

For this reason, ‘racemic’ came to mean ‘an equal mixture of enantiomers’, and this term continues to be ubiquitous in organic chemistry today.

So where does Pasteur fit into this story? Early in his career, before he discovered vaccination, microbial fermentation and invented the process which still bears his name (pasteurization), Pasteur studied crystals of tartaric acid and ‘paratartaric acid’ obtained from wine sediments. In particular, he wondered why (as described above) tartaric acid rotated light, while paratartaric acid did not, even though the chemistry and elemental composition of the two were identical. In one of the most beautiful and famous experiments in the history of science, Pasteur noticed, while squinting down a microscope, that there were two subtlety different types of crystals in the samples of paratartaric acid, each the mirror image of the other (see diagram below). He very carefully (and tediously) separated the two types of crystals into separate piles, redissolved each pile, and found that each did indeed rotate light, but in opposite directions. He had, in effect, separated the two enantiomers from the paratartaric acid (a.k.a. racemic acid) and discovered molecular chirality.

The two types of crystals found in paratartaric acid, which are mirror images of each other.

The two types of crystals found in paratartaric acid, which are mirror images of each other.

What does it look like?

The structure of D-tartaric acid (left) and its mirror image, L-tartaric acid (right).

The structure of D-tartaric acid (left) and its mirror image, L-tartaric acid (right).


Where did the structure come from?

D-tartaric acid can be found under CCDC refcode TARTAC, while L-tartaric acid is at CCDC refcode TARTAL.

Give me a resin

What is it?

Is there a more evocative Christmas smell than the fragrance of a fresh pine tree? Mulled wine with cinnamon spices or a roasting turkey are close contenders for the prize, but for literary purposes let’s opt for the heady scent of a Christmas Fir. That rich winter wonderland terpentine-like citrus aroma is the product of several molecules (read more here http://www.compoundchem.com/2014/12/19/christmastrees/), the most significant of which is pinene.

Pinene is a terpene found in the resin of pine trees, and as well as generating the distinctive coniferous scent, it is also a potent inhibitor of the human Cytochrome P450 2B enzyme. CYP450 proteins are a superfamily of enzymes essential for hormone, cholesterol and vitamin D synthesis and metabolism. They also assist in the clearance of toxins from the body via the liver. So, if you ever you needed a “resin” not to eat your Christmas tree…

What does it look like?

Pinene

Researchers determined the crystal structure of (+)–α-pinene bound to CYP450 2B6 to better understand how this pine tree molecule can bind, inhibit, and alter the enzyme1. This is important to learn about how the enzymes generally interact with a diverse range of substrates.

(+)-α-pinene binds tightly at the CYP450 2B6 active site. The CYP450 2B6 active site is remarkably flexible and moves and shifts to mould around the pinene molecule as it binds.

Where did the structure come from?

This structure is of human CYP450 2B6 and is PDB ID 4I91.

References

  1. Wilderman et al., Journal of the American Chemical Society 2013: 135: (10433-10440)

Why does a lobster change colour on cooking?

Prof John Helliwell answers one of those Australian Christmas conundrums – why do lobsters change colour when you cook them?  Crystallography has the answer:

lobster

This posting, Helen Maynard-Casely tells me, has a Christmas aspect. At Christmas time colleagues ‘down under’ are tucking into cooked lobster whilst the rest of us ‘up north’ are having Christmas turkey!

What is it?

Crystal grown by the microbatch method in a 2µl drop under oil. The photograph shows the natural blue colour of the crystal. Crystal size: 100  ×  100  ×  500  µm. Courtesy of Prof Naomi Chayen.

Crystal grown by the microbatch method in a 2µl drop under oil. The photograph shows the natural blue colour of the crystal. Crystal size: 100  ×  100  ×  500  µm. Courtesy of Prof Naomi Chayen.

The active coloration molecule in the lobster shell is astaxanthin (AXT). When it is bound to the lobster protein complex crustacyanin it is blue-black and when not bound to the protein crustacyanin AXT is orange-red (at equivalent dilutions). The molecular geometric and electronic factors which cause this colour change (a bathochromic shift) have been identified from the X-ray crystal structure of beta-crustacyanin (Cianci et al 2002). The protein releases its grip on the AXT when the protein would be denatured – such as by boiling. The AXT causes the crustacyanin to adopt a quite different arrangement of protein subunits compared with the apocrustacyanin (Cianci et al 2001).

dimer_2

Apocrustacyanin A1 dimer (Cianci et al 2001 Acta Cryst D)


The whole project of studying beta-crustacyanin and of apocrustacyanin by X-ray crystallography was made possible through the expert research on macromolecular crystallisation, and also the growth of these particular crystals, by Prof Naomi Chayen and her coworkers at Imperial College in London.

Apocrustacyanin A1 crystals; different crystal habits, identical unit cell dimensions (Naomi Chayen, Imperial College, London).

Apocrustacyanin A1 crystals; different crystal habits, identical unit cell dimensions (Naomi Chayen, Imperial College, London).

Intriguingly other lobster crustacyanins such as the Australian Western Rock Lobster has ‘red’ and ‘white’ phases of its life cycle but not blue-black along with an interesting genetic make up in this respect (Wade et al (2009)).

Other lobster crustacyanins; the Australian Western Rock Lobster (which has ‘red’ and ‘white’ phases); also only one gene (type 2)

Other lobster crustacyanins; the Australian Western Rock Lobster (which has ‘red’ and ‘white’ phases); also only one gene (type 2)

Cianci, P.J. Rizkallah, A. Olczak, J. Raftery, N.E. Chayen, P.F. Zagalsky and J.R. Helliwell “Structure of apocrustacyanin A1 using softer X-rays” (2001) Acta Crystallographica Section D-Biological Crystallography D57, 1219-1229.

Cianci, P.J. Rizkallah, A. Olczak, J. Raftery, N.E. Chayen, P.F. Zagalsky and J.R. Helliwell “The molecular basis of the coloration mechanism in lobster shell: β-crustacyanin at 3.2 A resolution” (2002) PNAS USA 99, 9795-9800.

Wade, N.M.; Tollenaere, A.; Hall, M.R.; Degnan, B.M. Evolution of a Novel Carotenoid–Binding Protein Responsible for Crustacean Shell Color. Mol. Biol. Evol. 2009, 26(8), 1851–1864.

A little helper – Elf3

What is it?

E74-like factor-3 (Elf3) is a transcription factor. This means that it is a protein involved in the expression of genes. Elf3 works with other proteins to regulate genes involved in inflammation and cancer; it is has been found to be abnormally expressed in some lung and breast cancers.

In order to ensure proper gene expression, transcription factor activity is highly regulated. Accordingly Elf3 is held in an “off” state and must be specifically turned on before it can bind to DNA to start gene expression. The interaction of Elf3 with DNA is also highly specific, again to avoid abnormal gene expression that may lead to disease.

In order to learn how Elf3 recognises, binds and activates gene expression, researchers solved the crystal structure of the Elf3 bound to DNA from one of its target genes.

What does it look like?

ELF3This structure is of a specific part of mouse Elf3, the so-called E-twenty-six (Ets) domain, bound to DNA from mouse Type II TGF-b receptor promoter. Promoter DNA sequences provide a “start to read me from here” instruction to transcription factors so this structure provides lots of information about how the two molecules talk to each other.

Elf3 (green) is shown bound to DNA (red double helix)

Where did the structure come from?

This structure is PDB ID 3JTH1.

References

  1. Agarkar et al., Journal of Molecular Biology, 2010. 397, 278-289

Merry Christmas – Ho Ho Ho

Dave T tells us of his crystallographic Christmas inspiration!

Dave T tells us of his crystallographic Christmas inspiration!

What does it look like?

HoHoHo What is it?

Sitting at my desk on the last working Friday of the year, just minutes away from a barbeque, Dr Maynard-Casely lays down the challenge for a “cheesy-corny Christmas-themed post”. Distracted by Steve Smith’s century (on captaincy debut), thinking was not easy, until my mind turned to a project in which I am currently involved.

The complex shown above is a trinuclear complex containing three holmium ions – HoHoHo. This was reported in 2005 by Junk and Deacon and contains quinolinolate anions as the ligating groups. This anion is typically used in gravimetric analysis as it coordinates to metal ions to form highly insoluble complexes. A derivative of this ligand has been used in anti-diarrhoea medication and is also being investigated in anti-Alzheimer’s medication.

The structure has three holmium atoms in close proximity, bridged by the oxygen atoms of the quinolinolate ligands. A recent analogue of this compound containing dysprosium in place of holmium has been shown to act as a single molecule magnet at low temperatures (Chilton et al., Inorg. Chem., 2014, 53, 2528). This means that each molecule acts like a minute magnet, albeit at temperatures below that of liquid nitrogen. Solid state packing of these complexes is, unsurprisingly, dominated by pi-pi interactions.

Where did the structure come from?

The structure was published in Z. Anorg. Alleg. Chem., 2005, 631, 2647.